【Needle Coke】Analysis of Changes in Supply Structure in August

【Needle Coke】Analysis of Changes in Supply Structure in August
August is a season of abundance, filled with hope and anticipation. However, the needle coke market did not witness the long-awaited positive recovery; in fact, the market trading atmosphere became even more subdued. Needle coke enterprises have adjusted their production loads and patterns to cope with the current supply pressure.

Source: Oilchem
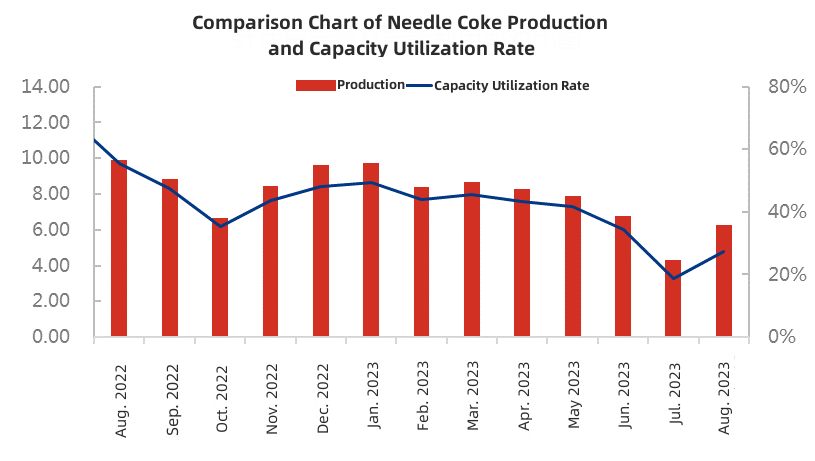
In August, the monthly production of needle coke in China was 62,400 tons, an increase of 44.44% compared to the previous month but a decrease of 36.9% compared to the same period last year. The capacity utilization rate was 27%, up 8 percentage points from the previous month but down 29 percentage points year-on-year. Looking at the production changes over the past six months, the demand for graphite electrodes and negative electrode materials has decreased since March, leading to a continuous decline in the needle coke market's activity for four consecutive months, with a slight recovery in August. As needle coke capacity continues to increase, competitive pressures have gradually intensified, becoming a significant factor restraining price increases in the market.

Source: Oilchem
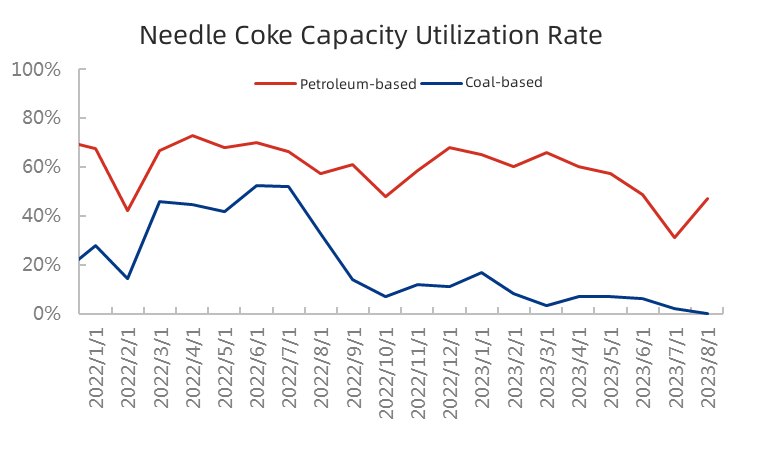
Regarding the utilization of capacity in coal-based and petroleum-based needle coke, coal-based needle coke was in a state of shutdown in August. The primary reason was the soaring prices of raw materials such as coal tar pitch, while the demand for finished needle coke in the market remained weak, resulting in prices declining. With raw material prices higher than product prices, coal-based companies incurred heavy losses. In contrast, the capacity utilization rate for petroleum-based needle coke in August was 47.09%, up 16 percentage points from the previous month but down 10.46 percentage points year-on-year. Therefore, petroleum-based needle coke is currently the mainstay of domestic needle coke supply.

Source: Oilchem
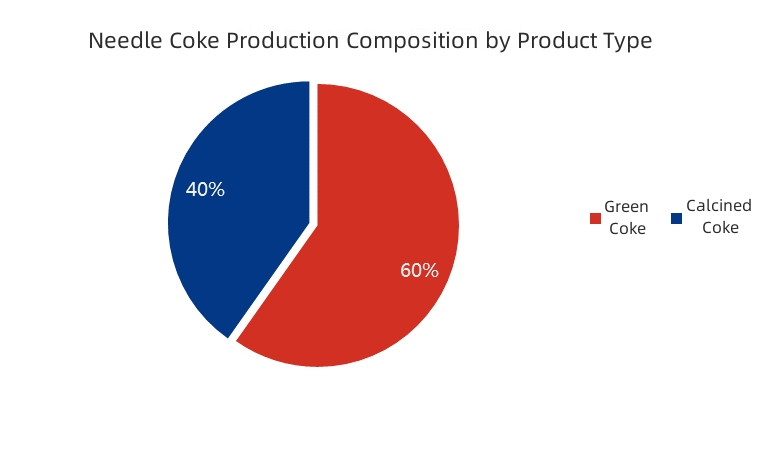
Looking at downstream demand in August, while there was a certain atmosphere of recovery for negative electrodes, cost reduction remained the main theme. Under the influence of the cost reduction trend, the use of petroleum coke increased to replace some needle coke in the negative electrode materials. Therefore, the consumption of needle coke in the production of negative electrode materials saw a limited year-on-year increase. In the case of ultra-high power graphite electrode production, there is no substitute for needle coke as a raw material. However, the demand for electrodes has decreased overall due to the poor performance of the steel industry. Therefore, guided by consumption trends, needle coke enterprises adjusted their product types. In August, needle coke's green coke production accounted for 60%, down 2 percentage points from the previous month, while calcined coke production accounted for 40%, up 2 percentage points.
In the long term, the new energy sector is still in an upward trajectory, with positive expectations for negative electrode materials, indicating a positive outlook for needle coke in the long run despite its short-term challenges. During the traditional peak season of September and October, there is expected to be an increase in demand in the automotive and steel industries, leading to higher usage expectations for needle coke. Feel free to contact us anytime to learn about the market trends in needle coke production.
No related results found


0 Replies